Tracking down a bug in Rust firmware
Between other things, I’ve been picking up a bit more maintenance work on the ATSAMD HAL, partly out of interest and partly to stay sharp in software work as I probably should start thinking about finding paid work again soon!
I’m starting this post just before picking up work on an open bug in the HAL; my intent is partly to share my approach, and partly as a record of what development for me looks like in early 2025. This feels like a transitional time; Rust is maturing and seems to be making inroads in the embedded field, my guess is that it’s here to stay. AI is very hyped, most of the professional programmers I know are using it to some degree although I’ve more-or-less intentionally avoided using it myself so far. Outside of the tech world, there are big changes afoot too!
The bug was identified by another of the HAL maintainers, who happens to be away travelling currently so I’m reasonably confident it’s not being worked on by anyone else. In case that GitHub link has died, the issue is to do with a strange behaviour when using a new API for configuring the clock system in an ATSAMD51 microcontroller. It’s a well written issue, with example code and enough background that I should be able to replicate the problem using hardware I have on hand. As written, there seem to be two separate issues: first the example firmware always locks up at a particular place, and second if that is worked around then the microcontroller seems to run slowly depending on some apparently-unrelated changes.
The second of these issues seems quite strange, and the better one to start with.
Basic Setup
Usually, my first step in fixing a bug is to reproduce it. Rather than starting
a stand-alone project for this sort of thing, I generally abuse Cargo’s (the
Rust build system and package manager) “example” feature. In a terminal within
a Codium (essentially, the open source parts of VSCode IDE) window, I start by
pulling the current state of the atsamd repo (here, dropping some uncommitted
changes I don’t need anymore), create a new branch for my work, and start
hacking on a handy example for the board I’ll be working on:
➜  feather_m0 git:(fix-wio-terminal) ✗ git checkout master
error: Your local changes to the following files would be overwritten by checkout:
        boards/wio_terminal/Cargo.toml
Please commit your changes or stash them before you switch branches.
Aborting
➜  feather_m0 git:(fix-wio-terminal) ✗ git diff
➜  feather_m0 git:(fix-wio-terminal) ✗ git reset --hard
HEAD is now at b38e5ca4ee fix wio_terminal: Suppress static mut ref warnings
➜  feather_m0 git:(fix-wio-terminal) ✗ git checkout master
Switched to branch 'master'
Your branch is up-to-date with 'origin/master'.
➜  feather_m0 git:(master) ✗ git pull
Already up-to-date.
➜  feather_m0 git:(master) ✗ git checkout -b issue-819
Switched to a new branch 'issue-819'
➜  feather_m0 git:(issue-819) ✗ cd ../metro_m4/
➜  metro_m4 git:(issue-819) ✗ codium examples/blinky_basic.rs
➜  metro_m4 git:(issue-819) ✗
I copy-and-paste the firmware from the ticket over the blinky_basic example file, and try to build it:
➜  metro_m4 git:(issue-819) ✗ cargo build --example=blinky_basic
    Updating crates.io index
     Locking 5 packages to latest compatible versions
      Adding as-slice v0.1.5
      Adding generic-array v0.12.4
      Adding hash32 v0.1.1
      Adding heapless v0.5.6 (available: v0.8.0)
      Adding seeed-erpc v0.1.2
   Compiling cortex-m v0.7.7
   Compiling nb v1.1.0
   ...
   Compiling darling v0.20.10
   Compiling embassy-executor-macros v0.6.2
   Compiling serde_yaml v0.9.34+deprecated
   Compiling atsamd-hal-macros v0.2.3 (/home/irees/Projects/20201112 - atsamd-rs/atsamd-hal-macros)
   Compiling atsamd-hal v0.21.0 (/home/irees/Projects/20201112 - atsamd-rs/hal)
    Finished `dev` profile [unoptimized + debuginfo] target(s) in 20.81s
➜  metro_m4 git:(issue-819) ✗
Thankfully that worked! Wouldn’t have been surprised if I needed to add defmt to Cargo.toml or something along those lines.
Distractions are a common thing in my world, and about at this stage, I got an email from a contact who does conservation work in the Catlins. He’s wanting some help building a remote trigger for a pig trap, and there are a number of reasons this is interesting to me - but those can go in a separate post! Also, a few texts with a friend who I’m meeting for dinner and to watch some climbing films; I should leave the house shortly!
I plug in my SWD debugger to the Adafruit Metro
M4 board (which is incidentally wired up
to some bits for [my Leaf hacking project]), and back in the terminal verify
that I’ve got an Embed.toml file handy with appropriate settings (mainly, to
enable defmt logging).
➜  metro_m4 git:(issue-819) ✗ cat Embed.toml
# See cargo-embed docs for configuration options:
# https://github.com/probe-rs/cargo-embed/blob/master/src/config/default.toml

[default.general]
chip = "ATSAMD51J19A"

[default.rtt]
enabled = true
up_channels = [
    { channel = 0, up_mode = "BlockIfFull", format = "Defmt" },
]
…and see if it runs!
➜  metro_m4 git:(issue-819) ✗ cargo embed --example=blinky_basic
    Finished `dev` profile [unoptimized + debuginfo] target(s) in 0.09s
      Config default
      Target /home/irees/Projects/20201112 - atsamd-rs/target/thumbv7em-none-eabihf/debug/examples/blinky_basic
      Erasing ✔ 100% [####################]  24.00 KiB @  80.45 KiB/s (took 0s)
  Programming ✔ 100% [####################]  23.00 KiB @  13.39 KiB/s (took 2s)                                                                                Finished in 2.02s
        Done processing config default
Per the description, I observe the firmware hanging indefinitely (which, it
shouldn’t), so Ctrl+c out of the defmt terminal and edit the code to swap the
order of a couple lines to see if another strange behaviour reproduces - this
time the firmware should periodically output Tick:
    loop {
        // A long `nop` delay as a rough way of comparing CPU clock speeds
        defmt::debug!("Tick");
        cortex_m::asm::delay(100_000_000);
    }
But! What I actually see is identical to earlier - nothing! Whoops, forgot to tell defmt to enable debug level logging:
DEFMT_LOG=debug cargo embed --example=blinky_basic
And, now can confirm both the indefinite hang waiting for dpll0 to lock at this line
while !(dpll0.is_ready() && dpll0.is_locked()) {}
and, I can confirm the strange slowing-down when some seemingly-unrelated Cargo features are enabled.
…it’s really time to run to town!…
Back at it the next day, with less time constraint!
Strange Behaviour About Speed
One of the oddities in this bug, is that the firmware consistently behaves
differently when a bit of presumably unrelated code changes - in one condition
the main CPU clock seems to run at the default 48MHz, and in the other condition
it’s sped up to 100MHz as the source code intends to do. In the ticket, the
example of an unrelated change is including a macro which should expand just in
to some type/function declarations; I actually found that simply enabling the
rtic or usb features of the BSP would cause the CPU clock to run at 48MHz,
but building without those features would result in a 100MHz clock with no code
changes!
I’d like to understand what exactly is different between these two cases, starting by running the firmware in a debugger - first the 100MHz case (which is the intended clock rate). But first, a slight deviation to sort some tooling!
Using PyCortexMDebug
The things I’m interested in all relate to clocking, for example the DFLL48M and GCLK, and those are controlled by a bunch of registers. Rather than decoding the values of these registers by manually referencing the datasheet, I’d like to leverage the SVD file (which is conveniently in the atsamd repo under /svd/ATSAMD51J19A.svd). The process is described in a few blog posts, such as this one, however I needed to do a few extra steps to get it to work on my system. Following a clue from this GitHub comment, I installed PyCortexMDebug in a Python venv, activated that venv, used the .gdbinit from this post to get it all going.
Unfortunately:
(gdb) svd GCLK GENCTRL[0]
Fields in GCLK > GENCTRL[0]:
Python Exception <class 'gdb.MemoryError'>: Cannot access memory at address 0x40001c20
Error occurred in Python: Cannot access memory at address 0x40001c20
A quick search later and I’ve got a .gdbinit file that connects to the running
micro (via that cargo-embed socket from above) and loads the appropriate SVD for it:
# Intended to be used from a venv with PyCortexMDebug installed:
#
# metro_m4 ➜ source ~/Projects/PyCortexMDebug-venv/bin/activate
# (PyCortexMDebug-venv) metro_m4 ➜ gdb-multiarch path/to/binary

python
import os,subprocess,sys
# Execute a Python using the user's shell and pull out the sys.path (for site-packages)
paths = subprocess.check_output('python -c "import os,sys;print(os.linesep.join(sys.path).strip())"',shell=True).decode("utf-8").split()
# Extend GDB's Python's search path
sys.path.extend(paths)

# load svd tools
from cmdebug.svd_gdb import LoadSVD
from cmdebug.dwt_gdb import DWT
DWT()
LoadSVD()
end

target remote localhost:1337
set mem inaccessible-by-default off
svd ../../svd/ATSAMD51J19A.svd
And, this allows me to inspect the state of peripherals, for example:
(gdb) svd GCLK GENCTRL[0]
Fields in GCLK > GENCTRL[0]:
        SRC:       DPLL0  DPLL0 output - Source Select
        GENEN:         1  Generic Clock Generator Enable
        IDC:           0  Improve Duty Cycle
        OOV:           0  Output Off Value
        OE:            0  Output Enable
        DIVSEL:     DIV1  Divide input directly by divider factor - Divide Selection
        RUNSTDBY:      0  Run in Standby
        DIV:           0  Division Factor
(gdb)
Debugging in GDB
With PyCortexMDebug and a suitable .gdbinit from the above diversion about
PyCortexMDebug, I can now examine the state of the microcontroller when it’s run
in either the fast or slow condition. This uses cargo-embed’s GDB server,
enabled by editing Embed.toml like this so it listens for GDB connections on
port 1337:
[default.gdb]
enabled = true
gdb_connection_string = "127.0.0.1:1337"
This is what a debugging session looks like:
However, comparing all the registers that I can think of being relevant, I’m not seeing any differences between the fast case and slow case…
Measuring the Clock
Beginning to suspect a hardware bug, I go to Microchip’s website and download the latest copy of “SAM D5x/E5x Family Silicon Errata and Data Sheet Clarifications”. There are a few errata relating to the various bits of clocking we’re using…
As I study without finding any relevant-looking errata, I wonder if the “slow” case is actually running the CPU at 50MHz rather than 48MHz. The intent of the firmware is to use the DFLL48M to generate 48MHz, use GCLK1 to divide that down to 2MHz, then DPLL0 to multiply that by 50 for a 100MHz GCLK0 that runs the CPU. I don’t have much experience with digital PLLs, but offhand it does seem worth actually measuring the CPU frequency rather than observing roughly how long a delay of a million CPU cycles takes by eye!
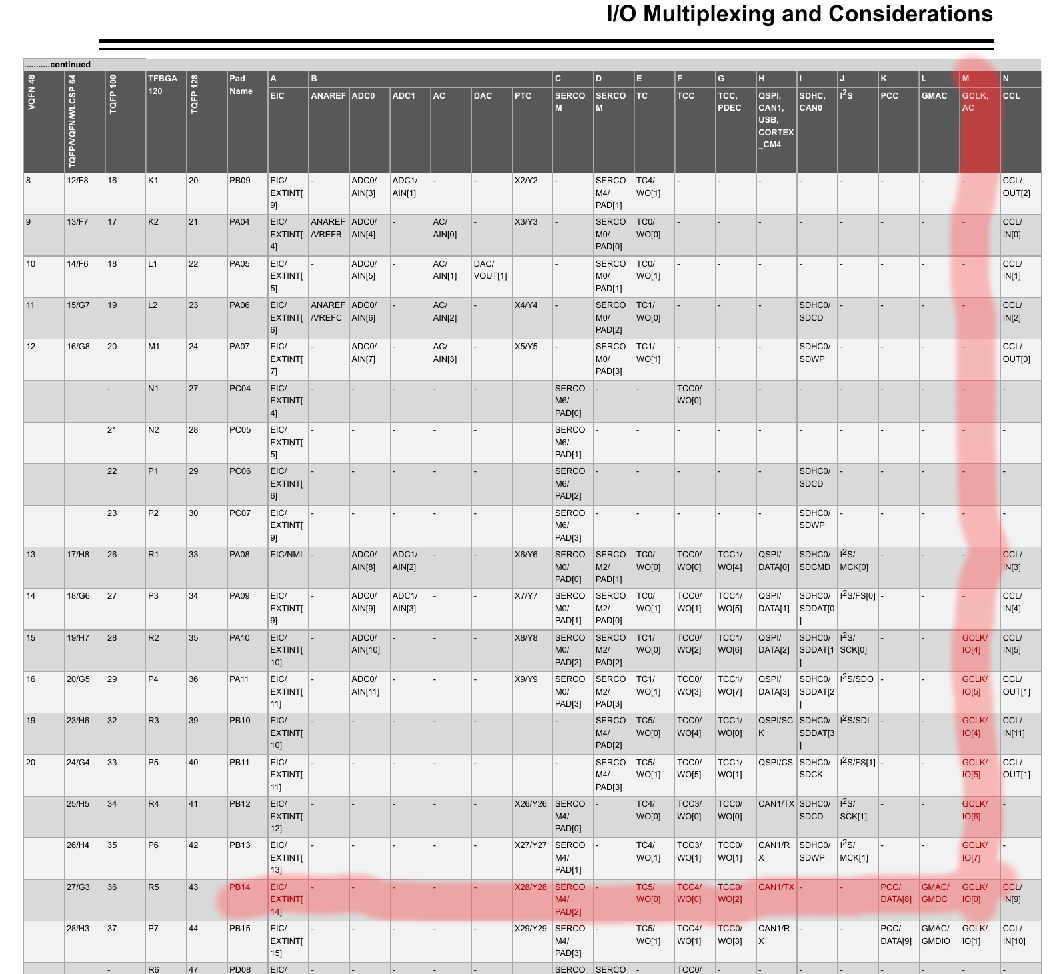
So, looking at the datasheet we can see that GCLK0 is MUXed to pin PB14 alternate function M, and the Metro M4 board I have brings that out on the pin labelled D5.
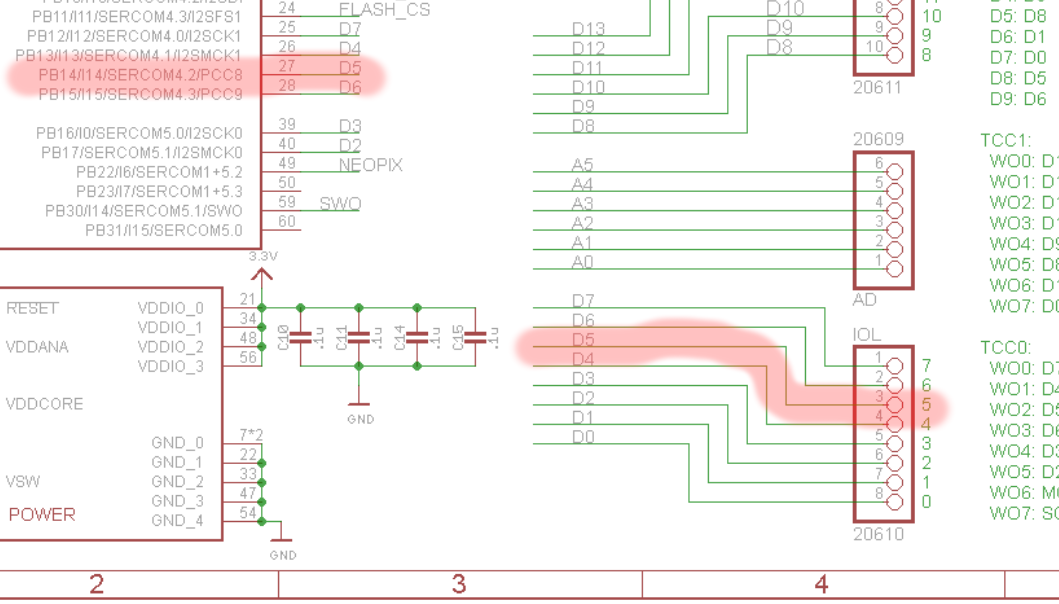
With a little bit of modification of the source, I can look at the output of GCLK0 with test equipment to try and understand what’s going on:
    let pins = bsp::Pins::new(peripherals.port);
    let (gclk0, gclk0_out) = gclk0.enable_gclk_out(pins.d5);
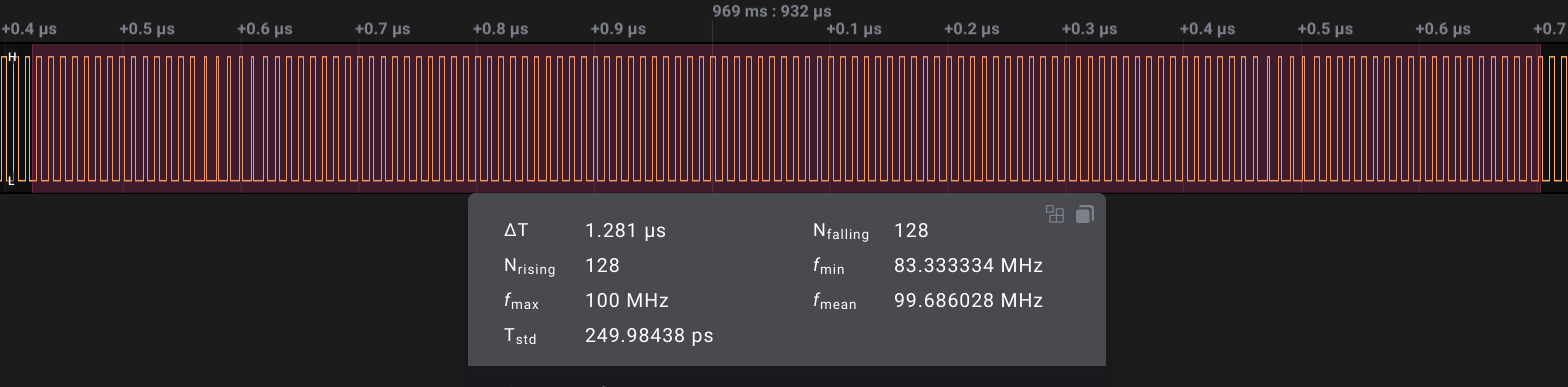
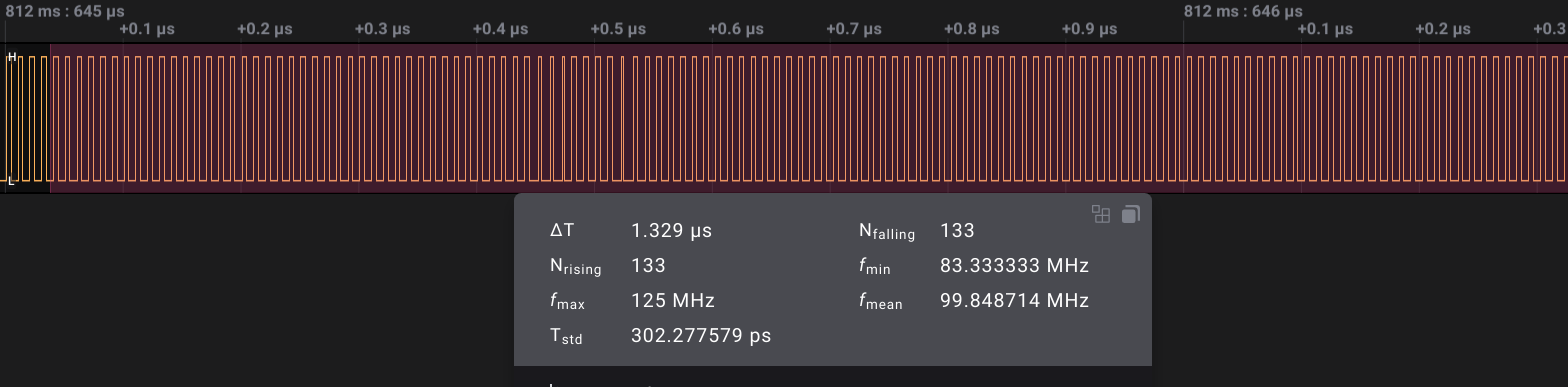
This results in some interesting observations:
| Fast case | Slow case |
|---|---|
| The difference is easily comparable in the defmt output (I didn't want to set up two concurrent hardware debugging sessions so did a bit of inceptioning with [asciinema]) | |
|
--This would be an asciinema video player if JS were enabled--
| |
| With a logic analyzer, there's no clear difference. Both cases show 100MHz with a little bit of aliasing which is expected since the LA is sampling at about 500Ms/s. Note I had to downgrade Saleae Logic from 2.4.22 to 2.3.40 to make this capture, as the newer version instantly crashes when starting a capture of the 100MHz clock at 500MS/s :(. | |
|
|
| With an oscilloscope, a little bit of fuzz becomes visible in the slow case, but it's not glaringly obvious. This indicates that the clock frequency is wandering around a bit, at least relative to the oscilloscope. But, it's at the edge of what my little oscilloscope is specified for so I don't put too much stock in this: | |

|

|
| With a spectrum analyzer, the difference becomes quite apparent, however both conditions are still definitely running at 100MHz: | |
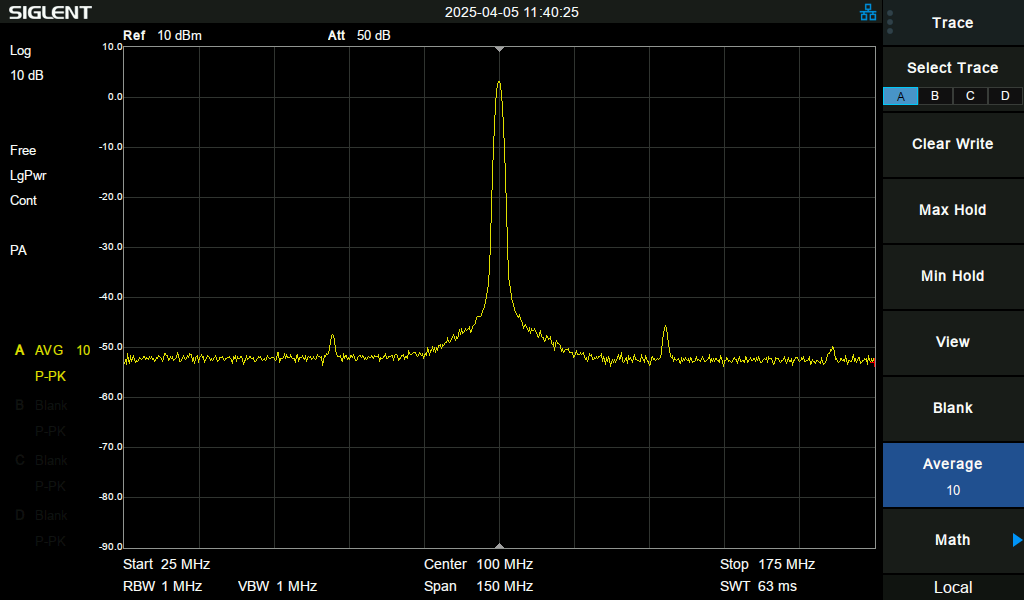
|
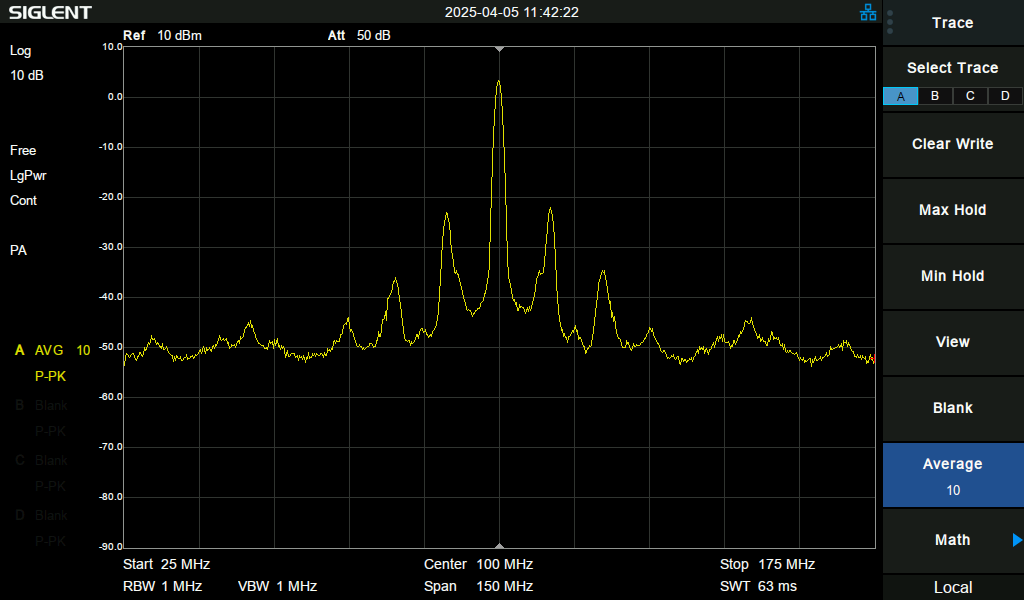
|
Phase Locked Loop (PLL) Filters
Both the DFLL48M and DPLL are Phase Locked Loops - basically they are meant to generate a signal that matches the phase of a supplied input. A PLL works similarly to the way a musician in a group might tap their foot to the beat of a tune: if their tap falls a smidge too late they’ll speed up, and if they’re a smidge too early they will slow down. The phase of the musician’s tapping is locked with the music when their foot falls exactly on a beat of the music.
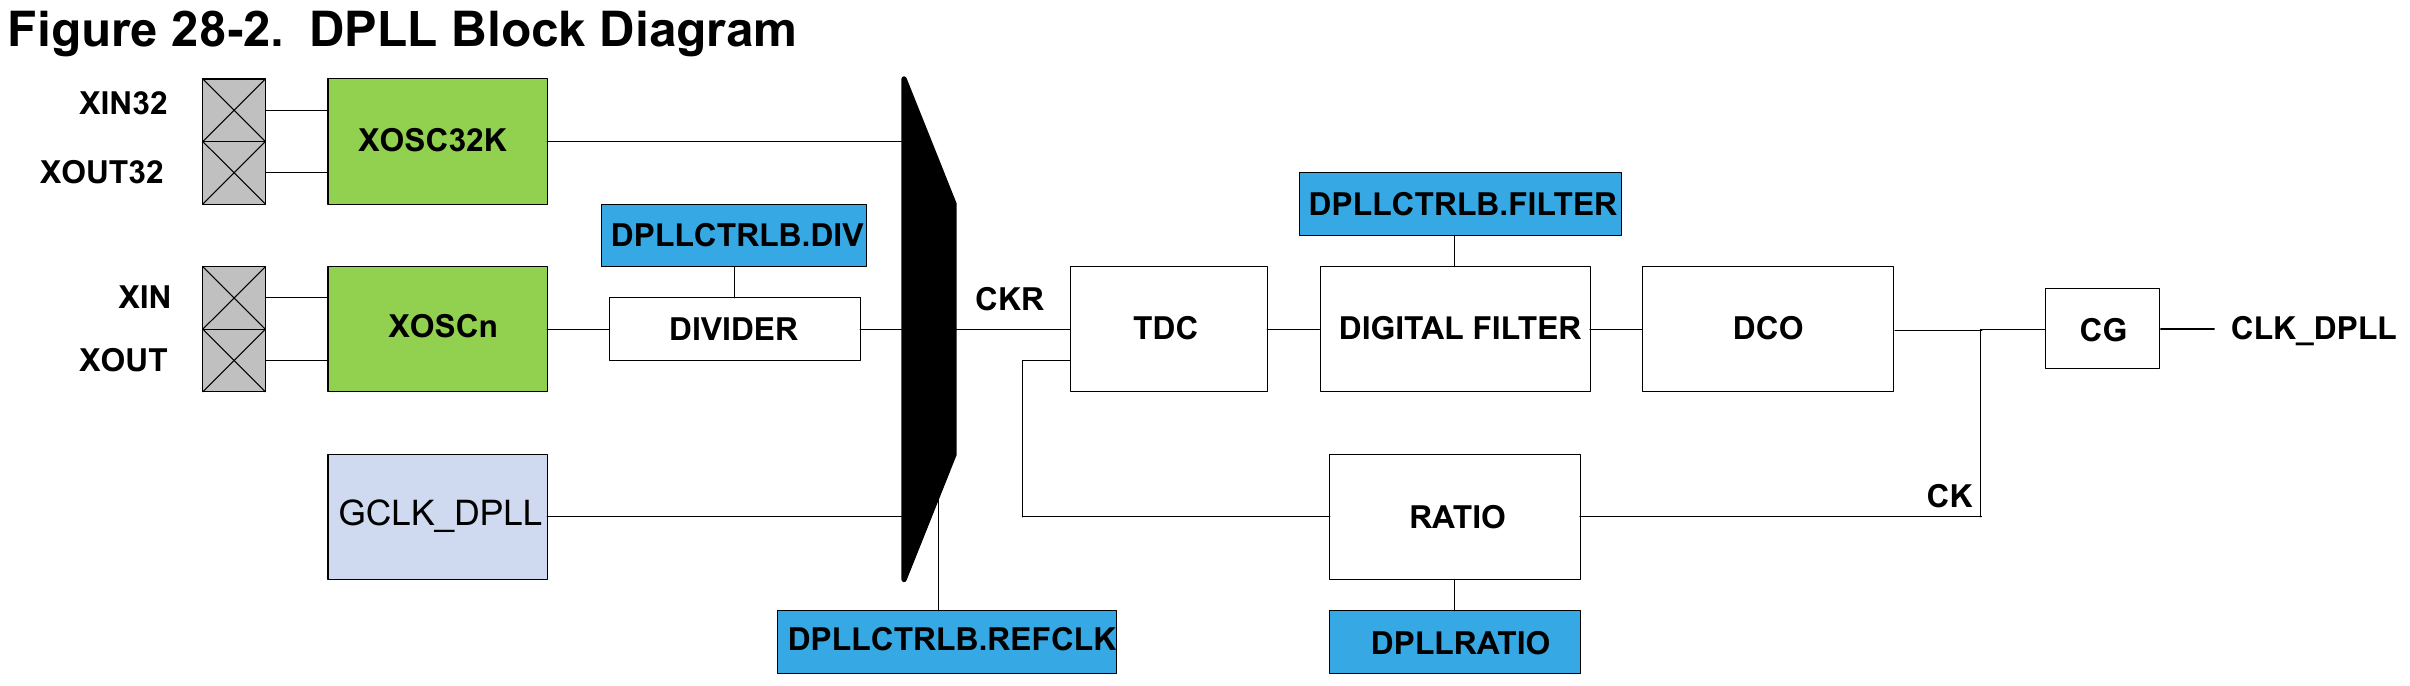
In practice, feedback loops (and so PLLs) need some amount of filtering in the loop to make them behave nicely, and the SAMD51’s DFLL48M and DPLL are no exception. Since we’re using the DFLL48M in open-loop mode, by definition there is no feedback and therefore the DFLL48M filters are irrelevant. The DPLL loop is in use though, and it contains two configurable filters: the “Digital Filter” and “DCO” which is short for Digitally Controlled Oscillator and contains a configurable (digitally) capacitor. Creative naming!
Tuning these sort of things falls under the umbrella of “controls engineering” and although I did study exactly that in university, I don’t remember much detail of how it all works. Two facts work in my favour here though: The chip offers only a limited number of options for the settings, and the defaults usually work!
Since I had my spectrum analyzer wired to the output of the DPLL, it was easy enough to try different filter options and observe any changes even if they weren’t significant enough to fix the overall issue. There were some very minor changes, but strangely they didn’t seem strongly dependant on the values of the filter settings but instead on random other code changes.
Seeing that these effects were about 40dB below the main clock signal, and there were no other observable effects, I committed the HAL code changes to support changing the DFLL filter settings and continued on.
Bypassing the Clock
At this stage, I’ve tinkered with this bug in fits and spurts over several days; although the post started on the 2nd, as I write this it’s the 11th. At this stage, I suspected something strange was happening with either the DFLL48M or the DPLL - perhaps we were missing some register synchronisation or not waiting at an appropriate point on setting those - however that still doesn’t quite fit with the way that the behaviour changes when simply enabling a couple unrelated Cargo features…
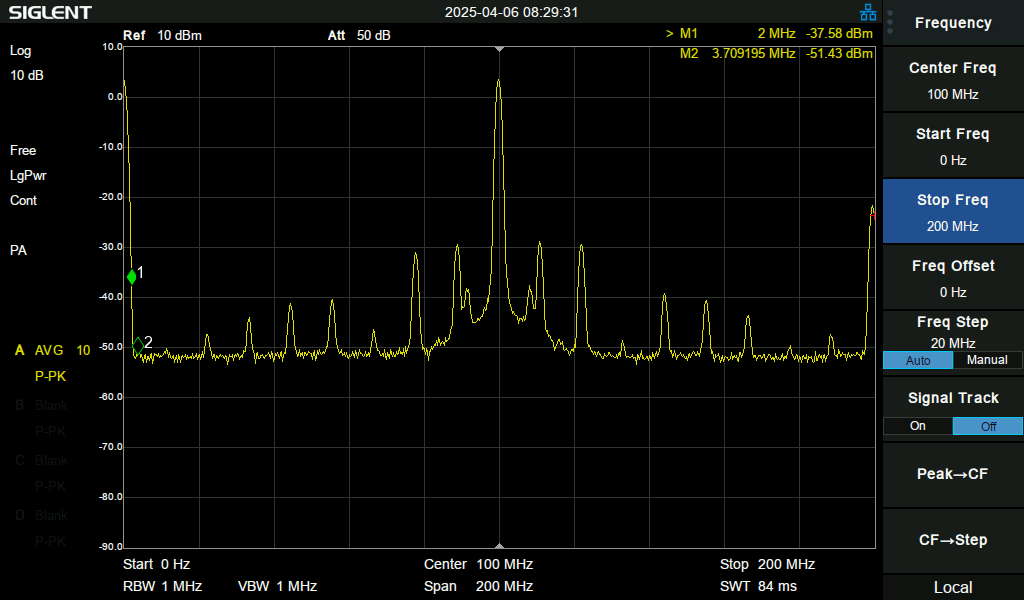
The Generic Clock Generators aka GCLKs in the SAMD51 clocking system are capable of either outputting their clock signal to an external pin as above, or they can take clock input from an external pin. With these features, I had an idea of how to narrow down the source of the problem: I’d configure the clocking tree to output a clock signal to an external pin, then bring that clock back in from another pin. This would allow me to wire these two pins together and confirm that the problematic behaviour still exists, then disconnect the wire and substitute a clock from my signal generator to bypass the earlier part of the clocking tree:
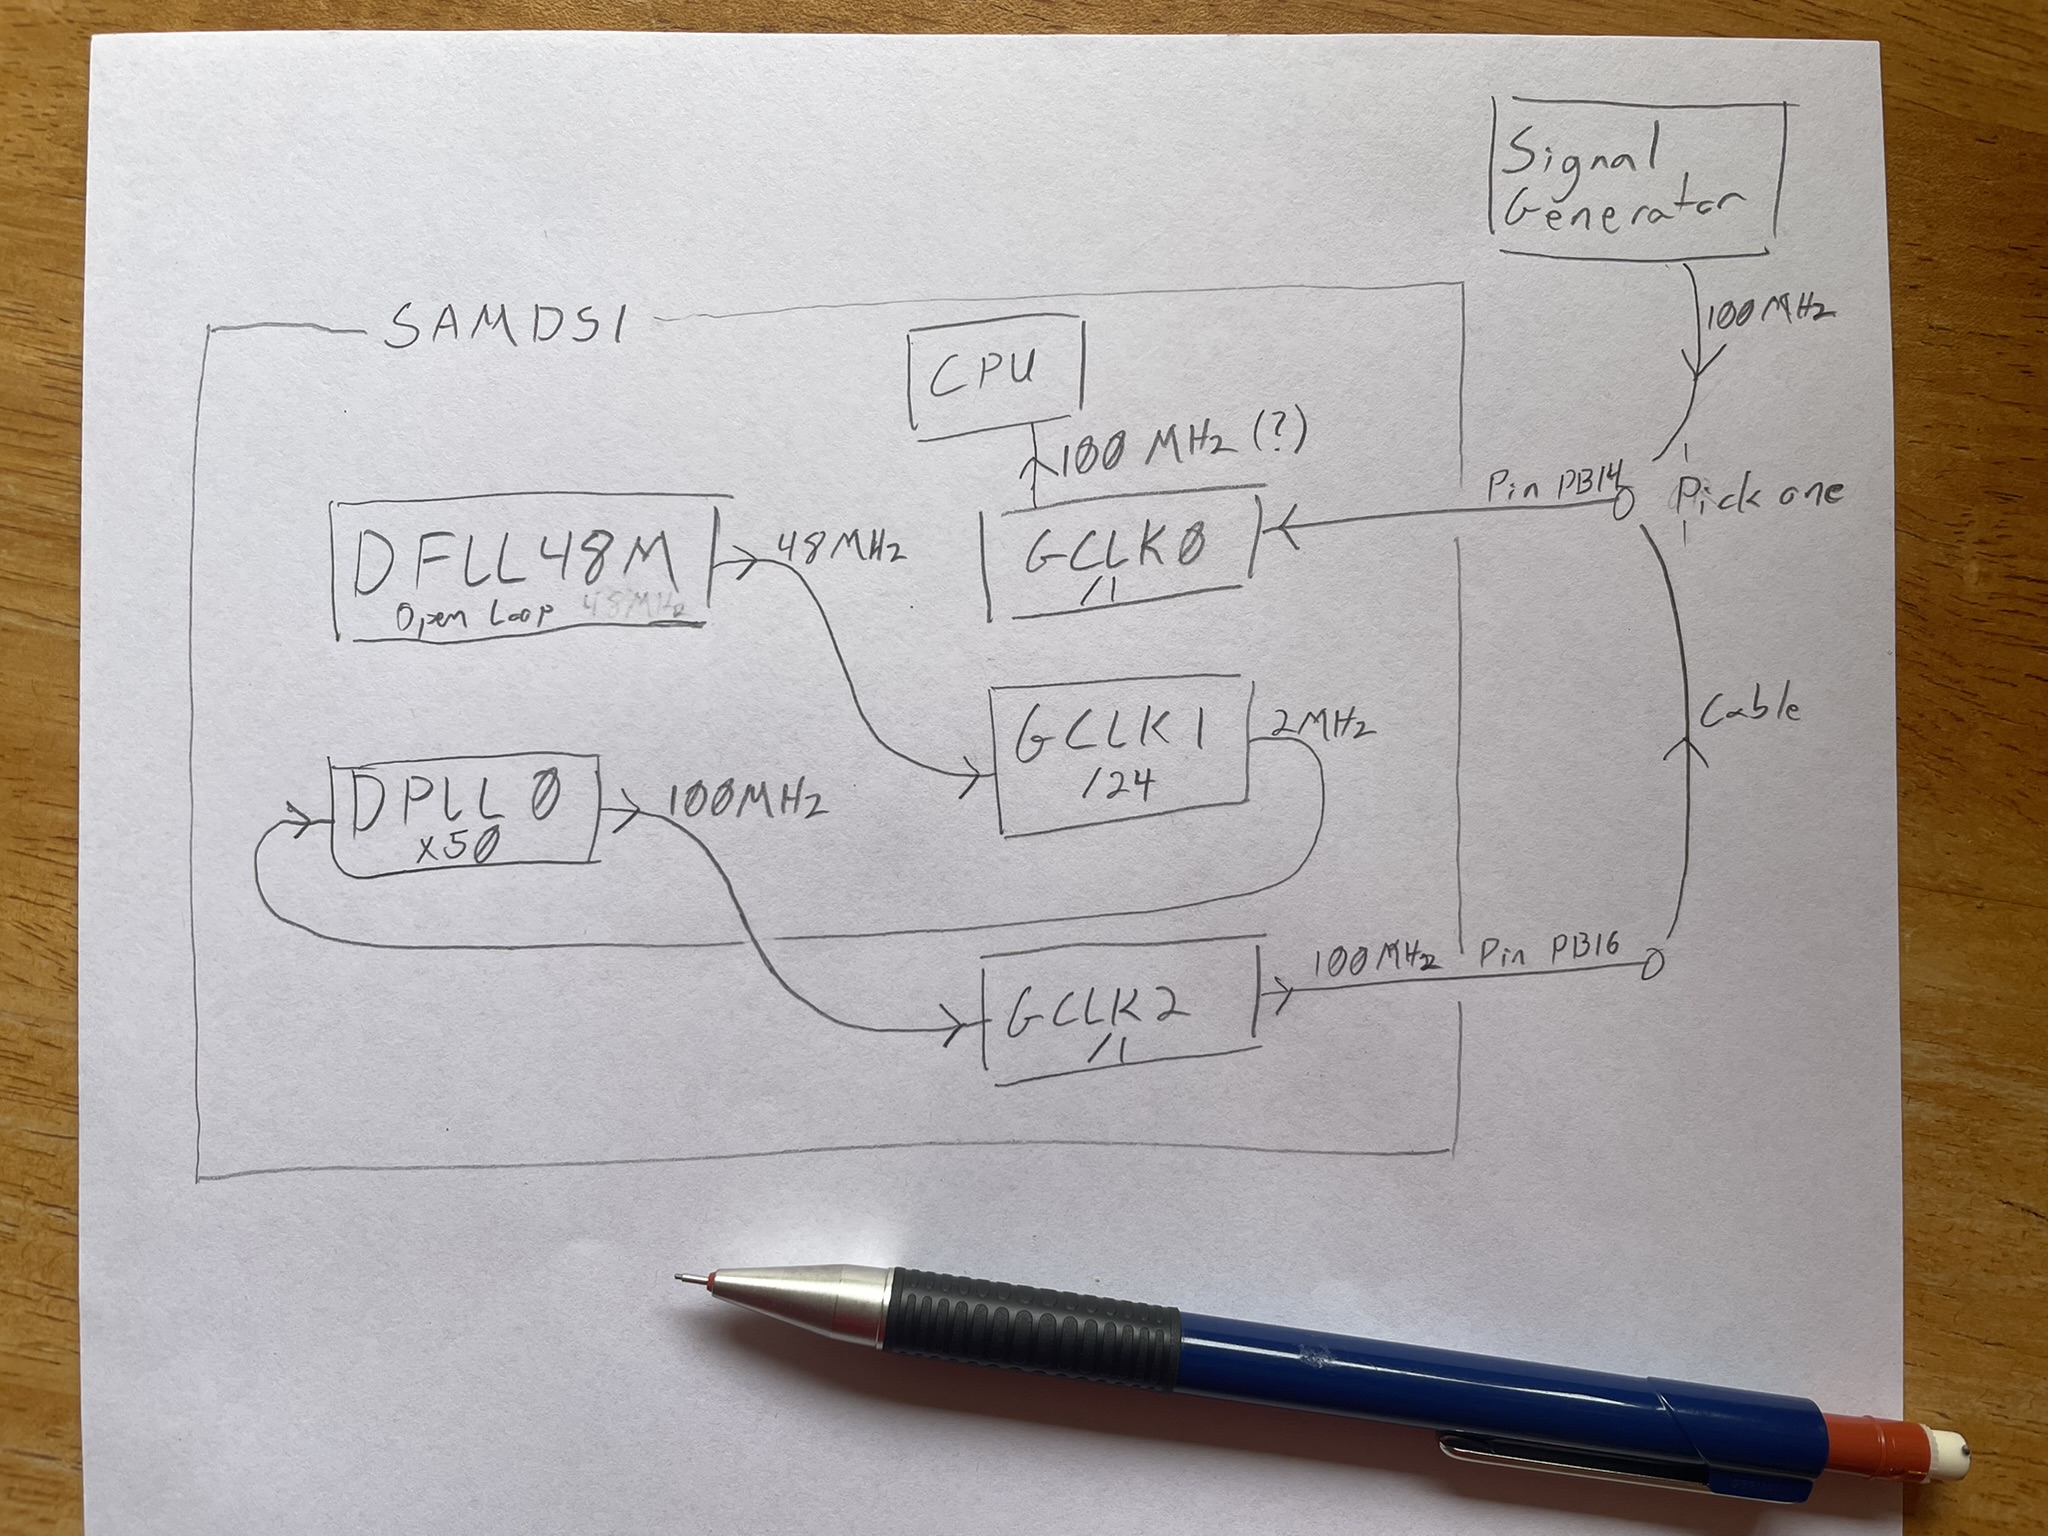
With the DFLL48M out of the clock tree and seeing the same weird behaviour when
running off a 2MHz clock from my signal generator, I realised that it wasn’t the
culprit. My signal generator is capable of outputting a square wave up to
25MHz, but a sine up to 120MHz, so substituting the 100MHz signal wasn’t quite
as solid of a test but with a clock provided by a 100MHz sine wave, it still
had the same weird behaviour - enabling --features="usb,rtic" made the defmt
output run a lot slower than firmware with only default features. To sanity
check my work, I connected the spectrum analyser to the same pin as I was
inputting the 100MHz clock to, and was surprised to see those same spurs appear
in the slow case.
So, a couple interesting oddities, but the evidence shows that the issue was not actually about stability of the 100MHz clock!
The Debug Interface
Through this work so far, I’ve had a debug probe (currently using a hs-probe) attached to the target board’s SWD header, to load new firmwares and get the logging out which goes over the probe-rs implementation of Segger’s RTT technology. RTT can involve interacting with the CPU, so there is some possibility of a bug in that causing strange behaviour. But, how do I determine if the firmware is going fast or slow, without the debug interface? Connect the logic analyzer to the Metro’s D13 pin, and change the code like so:
let mut debug_pin: bsp::RedLed = pins.d13.into();

loop {
    delay(100_000_000);
    debug_pin.set_high().unwrap();
    debug_pin.set_low().unwrap();
    defmt::debug!("Tick");
}
After confirming that I’ve still got the symptom where changing feature sets
results in Tick being logged faster or slower, I can disconnect the SWD and
reset the micro to see how it behaves… No change, so it’s probably not
related to the debug interface.
Power Supply
One thing I’ve learned about electronics is that basically any embedded symptom that isn’t clearly a software bug, can be caused by a power supply issue. In this case, I strongly suspect it isn’t a power issue because there is such a clear correlation with seemingly-irrelevant code changes, and I’ve already eliminated the entire clock tree as a source of this bug, but I’m running out of ideas! In fact, the datasheet does say that the chip must have the main regulator operating in linear mode to use the DFLL48M in open loop mode, as we’re doing here.
My investigation so far has been on a Metro M4 board, but I also have an Adafruit PyGamer which uses the same microcontroller. Luckily, it uses a slightly different power supply arrangement from the Metro M4, so I hook that up and load a test firmware.
Exactly the same symptom; the “Tick” messages show up a lot slower with some features enabled…
Decompiling
Thinking that the issue must be something to do with the code that runs before
main(), for example to initialise RAM, I downloaded an up-to-date
Ghidra and set out to compare the “fast” and “slow”
firmwares from above. Unfortunately, I didn’t find any relevant-looking
differences. At this point, I strongly suspected that clock setup code wasn’t
the problem, and there just wasn’t much more to the firmware, but I’m no expert
on Ghidra (nor decompiling software in general) so I wanted to simplify the
firmware absolutely as far as possible to cut through the noise. After a little
fiddling, I’d reduced the demonstration case to this, which didn’t use defmt,
and instead of using cargo features I’d toggle between the two versions of the
delay call to get the fast/slow conditions:
#![no_std]
#![no_main]

use metro_m4 as bsp;

use panic_halt as _;
use bsp::hal::pac::Peripherals;
use bsp::ehal::digital::OutputPin;
use cortex_m::interrupt;

#[cortex_m_rt::entry]
fn main() -> ! {
    interrupt::disable();
    let peripherals = Peripherals::take().unwrap();
    let pins = bsp::Pins::new(peripherals.port);
    let mut debug_pin: bsp::RedLed = pins.d13.into();

    loop {
        // use this delay for the slow case
        // cortex_m::asm::delay(100_000_000);

        // use this delay for the fast case
        for _ in 0..10 {
            cortex_m::asm::delay(10_000_000);
        }
        debug_pin.set_high().unwrap();
        debug_pin.set_low().unwrap();
    }
}
At this point, an oddity I noticed earlier loomed larger in my mind: after
setting up my LA to measure the execution speed, with code like above that sets
a GPIO pin high then immediately sets it back low, I’d noticed that the pulse
duration was basically the same regardless of whether the firmware overall was
in the fast or slow condition. It didn’t seem like the difference was actually
about the CPU clock speed, and strongly implied that the issue was actually that
delay() behaved differently in the two conditions. But, Ghidra showed me that
the compiler was generating effectively the same code in both cases:
                        **************************************************************
                        * DWARF original prototype: void __delay(u32 cyc)            *
                        **************************************************************
                        void __rustcall __delay(u32 cyc)
                        assume LRset = 0x0
                        assume TMode = 0x1
        void              <VOID>         <RETURN>
        u32               r0:4           cyc
                        __delay                                         XREF[3]:     Entry Point(*),
                        lib::__delay                                                 delay:0000473e(c),
                                                                                    .debug_frame::00003464(*)
00006938 01 21           movs       r1,#0x1
0000693a 01 eb 50 00     add.w      cyc,r1,cyc, lsr #0x1
                        LAB_0000693e                                    XREF[1]:     00006940(j)
0000693e 01 38           subs       cyc,#0x1
00006940 fd d1           bne        LAB_0000693e
00006942 70 47           bx         lr
Indeed, that method is implemented in assembly, and in this respect the compiler was doing exactly as requested. Here’s the code directly from the cortex-m crate at the time.
/// Blocks the program for *at least* `cycles` CPU cycles.
///
/// This is implemented in assembly so its execution time is independent of the optimization
/// level, however it is dependent on the specific architecture and core configuration.
///
/// NOTE that the delay can take much longer if interrupts are serviced during its execution
/// and the execution time may vary with other factors. This delay is mainly useful for simple
/// timer-less initialization of peripherals if and only if accurate timing is not essential. In
/// any other case please use a more accurate method to produce a delay.
#[cfg(cortex_m)]
#[inline]
pub fn delay(cycles: u32) {
    // The loop will normally take 3 to 4 CPU cycles per iteration, but superscalar cores
    // (eg. Cortex-M7) can potentially do it in 2, so we use that as the lower bound, since delaying
    // for more cycles is okay.
    // Add 1 to prevent an integer underflow which would cause a long freeze
    let real_cycles = 1 + cycles / 2;
    unsafe {
        asm!(
            // Use local labels to avoid R_ARM_THM_JUMP8 relocations which fail on thumbv6m.
            "1:",
            "subs {}, #1",
            "bne 1b",
            inout(reg) real_cycles => _,
            options(nomem, nostack),
        )
    };
}
In C, that method would look something like this:
void delay(uint32_t cycles) {
    cycles = 1 + cycles/2;

    top:
    cycles -= 1;
    if (cycles)
        goto top;

    return;
}
Or, for those folks unaware that goto exists in C :) :
void delay(uint32_t cycles) {
    cycles = 1 + cycles/2;

    do {
        cycles -= 1;
    } while (cycles);

    return;
}
How is it that the same machine code, on the same chip, clocked at the same speed - is somehow faster in one condition than another? I spent a bit of time scratching my head at that one, checked for a response to an earlier question on the Rust Embedded chat, took a break…
Although I’ve not dealt much with the Cortex-M4 core as is used in the SAMD51, I
have worked on other ARM cores and feel confident that the loop will behave as
the comment describes. It seemed a bit irritating for the delay() to be so
inaccurate though - either 3/2=1.5x or 4/2=2x as long as requested on all but
the big chips…
I wanted to check if there might be an instruction that could better serve to
delay the CPU for a full clock cycle, potentially enabling a more accurate
delay() (though, also confident that the folks that made the original
implementation would’ve done this already), so opened up the Technical Reference
Manual aka
TRM.
There, I found the culprit: the bne 1b line, on Cortex-M4, takes “1 or 1 + P”
cycles, and P is “The number of cycles required for a pipeline refill. This
ranges from 1 to 3 depending on the alignment and width of the target
instruction, and whether the processor manages to speculate the address early.”.
I wouldn’t speculate that the processor would speculate differently in these
cases, and the width of the target instruction is constant (the encoding of
subs {}, #1 isn’t changing between the fast and slow case), however the
alignment of that subs instruction was clearly changing! (nb: the Cortex-M4
uses the
Thumb-2
architecture which supports both 16b and 32b instructions)
The issue was that, if the compiler happened to align delay() so that the
subs instruction landed on at an 8B boundary - an address ending in 0x0 or 0x8
- then the bne to it would run in 2 cycles (each time around the loop, until
the last when it would take 1 cycle). So, with a 100MHz CPU clock, a call to
delay(100_000_000) would take about
Argument  real_cycles  subs  bne
    |         |         |     |
   \|/       \|/       \|/   \|/

100_000_000 / 2    *   (1  +  2)
--------------------------------  = 1.5 seconds
  100_000_000 cycles per second
However, if the compiler aligned delay() such that the subs was instead at a
4B alignment (address ending 0x4 or 0xC), the bne would usually take 3 cycles:
Argument  real_cycles  subs  bne
    |         |         |     |
   \|/       \|/       \|/   \|/

100_000_000 / 2    *   (1  +  3)
--------------------------------  = 2 seconds
             100MHz
…or a 2B alignment (minimum on the Thumb-2 architecture), 2.5 seconds.
looking at this a little later, these numbers don’t quite match what I actually observed - but above gets the point across
How to fix this? Tell the compiler to ensure the subs is aligned the same,
it’ll do this by inserting nop - No OPeration - instructions before the
subs. I opened a Pull
Request to do just that,
which was merged a couple days later, and we finally had resolution to this
oddity! Now the firmware might take a little bit more space due to those nop
instructions, but the delay() method won’t run slower in some compilations
than others!
commit 2e9892d1af22b80fb6cb50d364bb0bcb3625e576
Author: Ian Rees <code@ianrees.nz>
Date:   Mon Apr 14 15:18:41 2025 +1200

    Fix asm::delay() variability due to alignment

diff --git a/cortex-m/src/asm.rs b/cortex-m/src/asm.rs
index 756899f..47b286a 100644
--- a/cortex-m/src/asm.rs
+++ b/cortex-m/src/asm.rs
@@ -33,6 +33,10 @@ pub fn delay(cycles: u32) {
     let real_cycles = 1 + cycles / 2;
     unsafe {
         asm!(
+            // The `bne` on some cores (eg Cortex-M4) will take a different number of instructions
+            // depending on the alignment of the branch target.  Set the alignment of the top of the
+            // loop to prevent surprising timing changes when the alignment of the delay() changes.
+            ".p2align 3",
             // Use local labels to avoid R_ARM_THM_JUMP8 relocations which fail on thumbv6m.
             "1:",
             "subs {}, #1",
The Hang
Way back at the beginning of this saga, the original report on GitHub points out two issues; the first was that the test firmware would always hang on the same line - when that line was removed the firmware wouldn’t hang and the weird issue would surface that I’ve beaten to death above. The hanging line waited on DPLL0 to be ready:
while !(dpll0.is_ready() && dpll0.is_locked()) {}
As one might imagine, I spent a lot of time looking at the SAMD51 Datasheet while working through the other part of this bug. At some point in that process, I noticed this, about the way that the clocks can be run “on demand”:
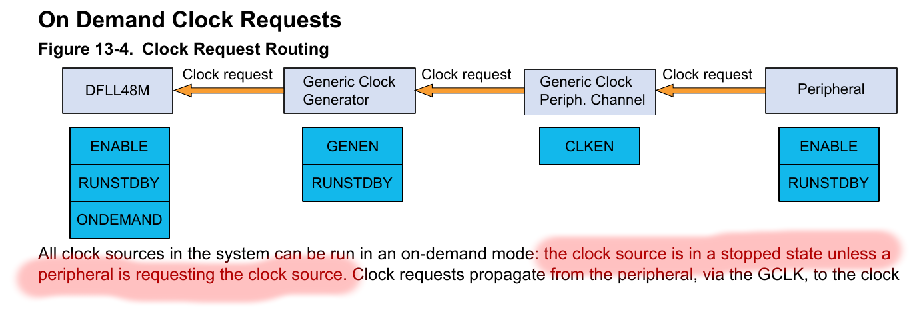
The issue was simply that the code above the hanging line set up the dpll0 like this, and it didn’t have any peripherals connected to its output:
let dpll0 = Dpll::from_pclk(tokens.dpll0, pclk_dpll0)
    .loop_div(50, 0)
    .enable();
This is basically what is known as the “builder pattern” in Rust, in this case
from_pclk() returns a struct that contains DPLL settings, and enable()
applies those settings to create a usable DPLL struct. The settings include
an on_demand boolean, which maps on to a configuration bit in the silicon DPLL
- by default it is true in both. So, there are two ways to fix this part of
the issue: either turn off on_demand by adding a call .on_demand(false), or
move the code that waits for the DPLL to become ready until after the DPLL is
put to use. The best code is what doesn’t get written!