QGIS
A program called QGIS has been on my radar for quite a few years now, since I was involved in developing FreeCAD and there was some cross-pollination between the two projects. Today, I finally spent some time playing around with QGIS and making some maps with data from Quantarctica.
This shows the Ross Ice Shelf, where I’ll be spending a few weeks this summer, along with the ice’s speed represented in false colour (to give some indication of where crevasses may be). Scott Base is near the Southern (up, in this map) tip of Ross Island, near the bottom-right. I believe KIS3 (the field camp we’ll be traversing to, and opening up) is about 82.6°S, 156°W - so toward the top of the map, a bit left of centre.
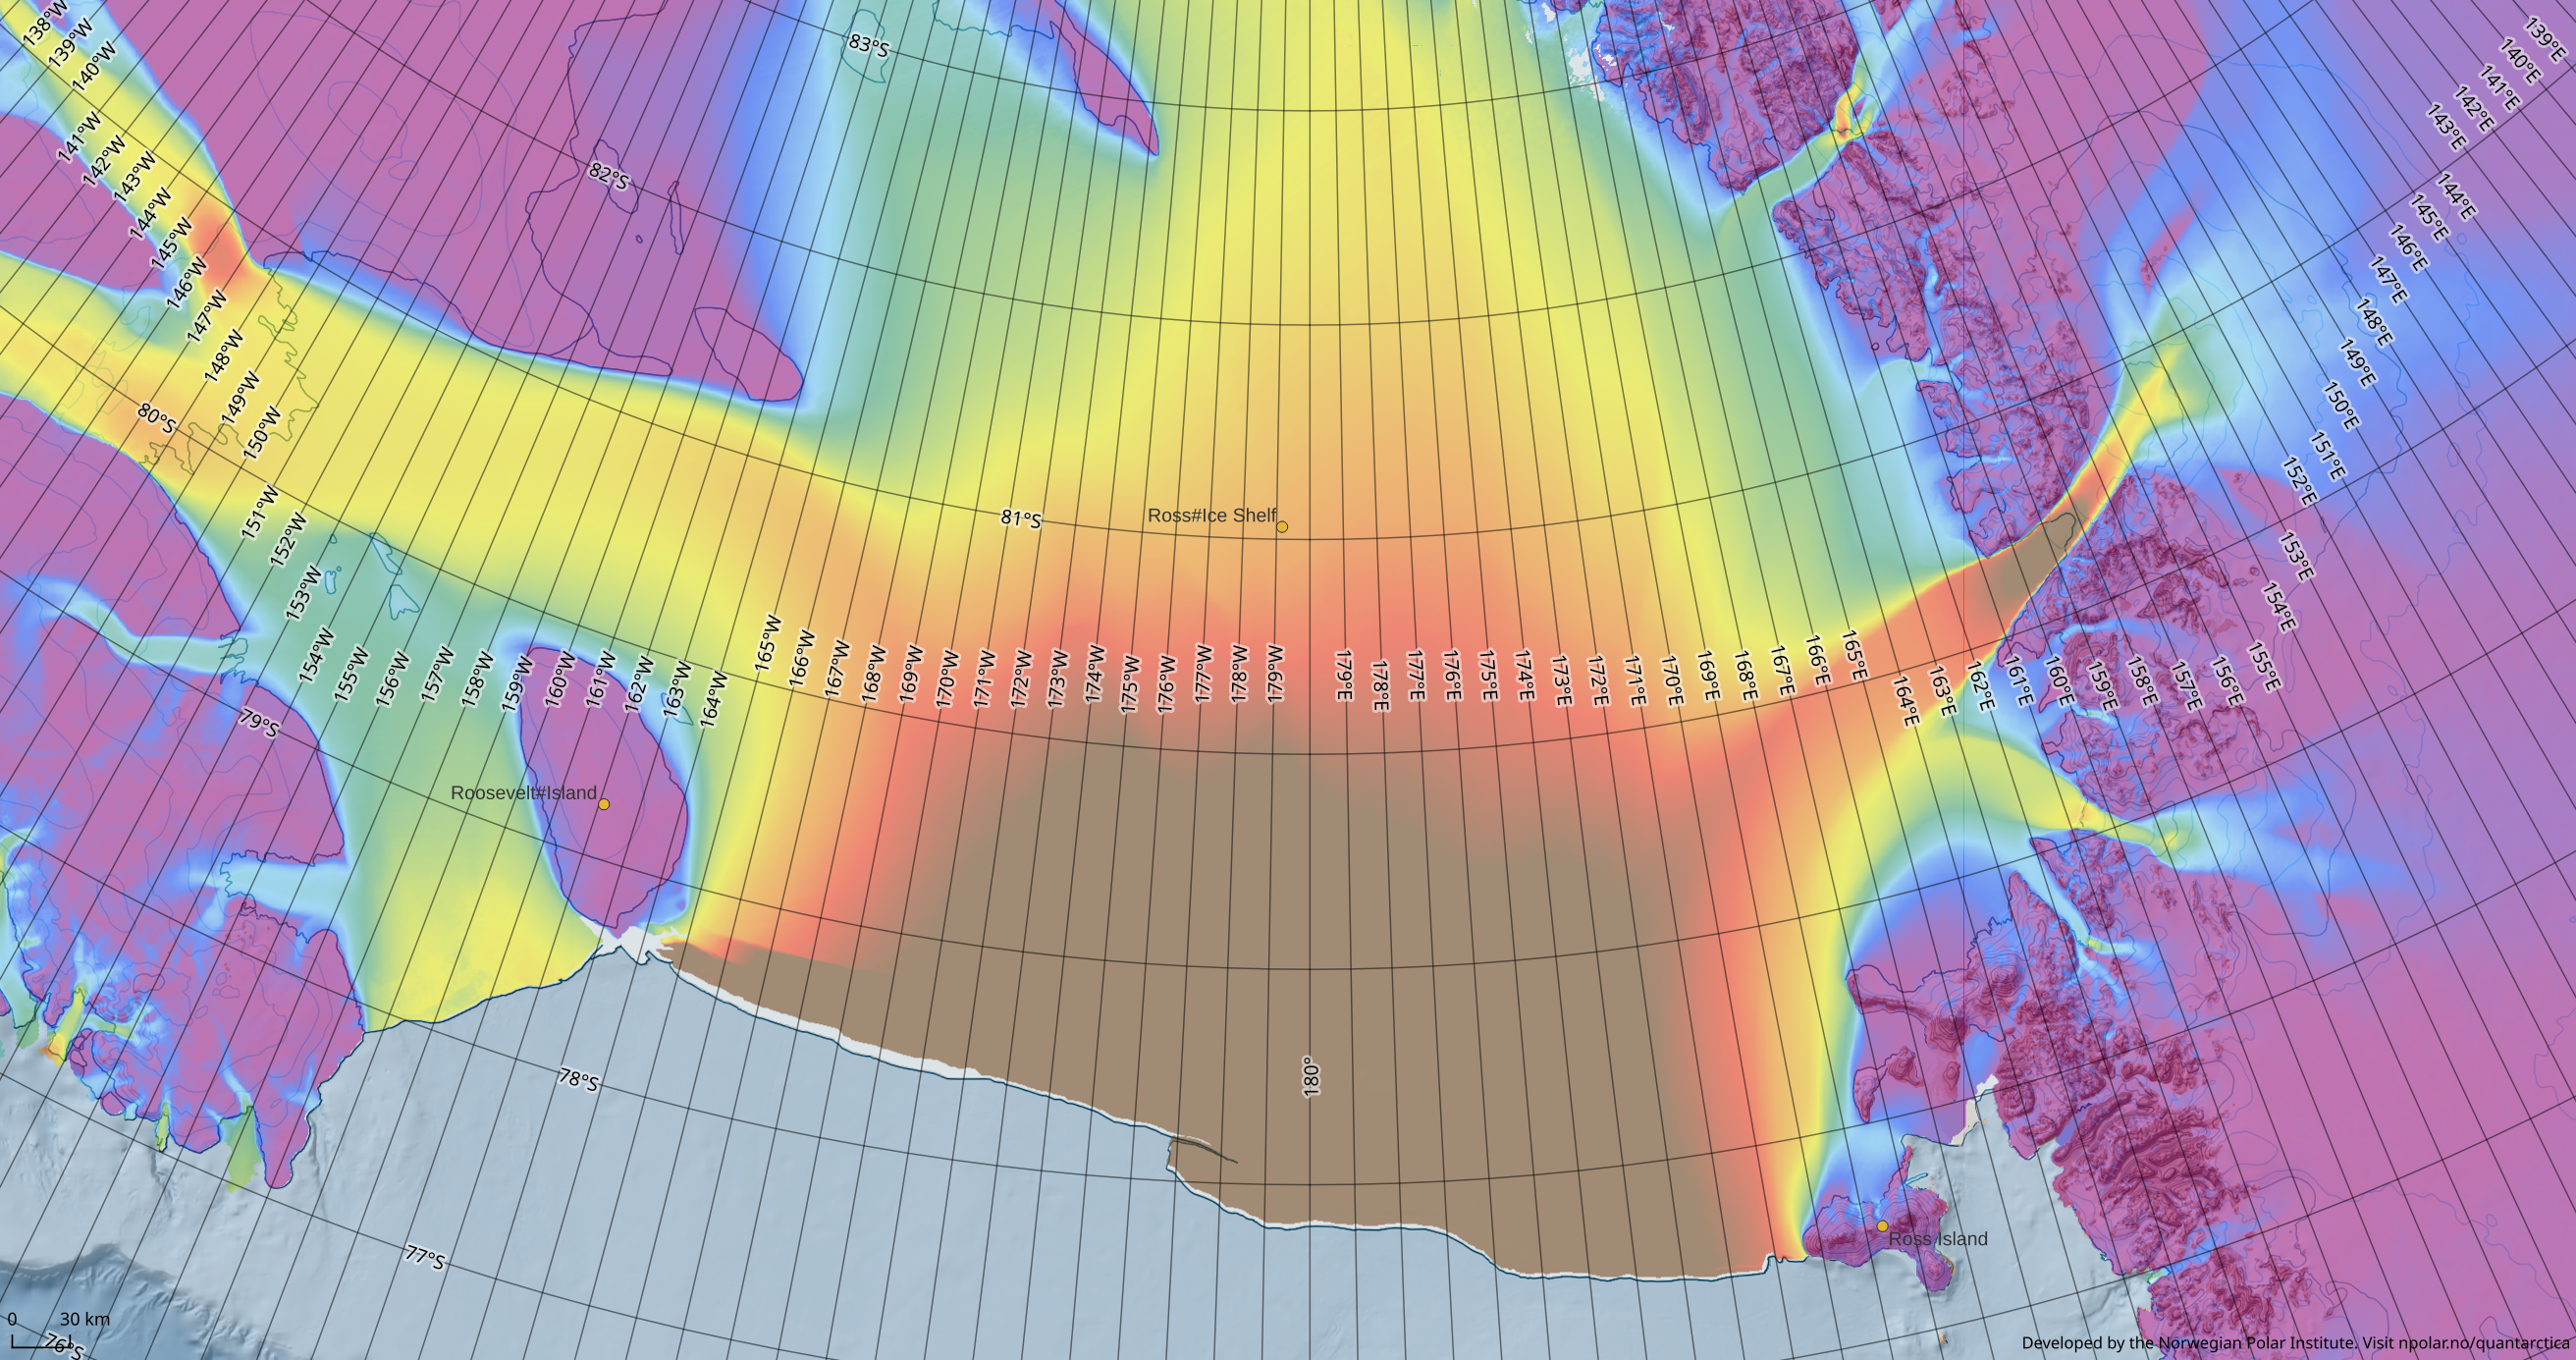
Putting this map together has been quite an interesting exercise. For one, it has made me realise that the field camp is actually quite a lot further South than I’d somehow imagined. I don’t know how that error crept in; from some of my earlier conversations with AntNZ, I’ve known that much of the route we’ll follow is also used by the South Pole Overland Traverse (SPOT)!
QGIS is a serious piece of software, maybe with a few rough edges (that I could try to fix!) - it seems very capable, and there’s a lot for me to learn about using it! A surprising amount of GIS data is freely available online, for instance Toitū Te Whenua - LINZ publishes what many Kiwis will recognise as Topo50 maps (plus a lot more), the above map is straight out of Quantarctica, of course there’s OpenStreetMap.